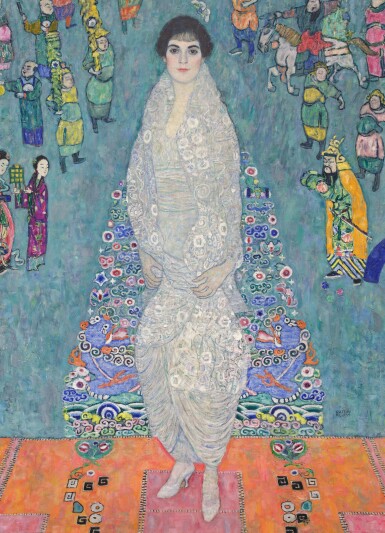
.jpg?width=900)
.jpg?width=900)
.jpg?width=900)
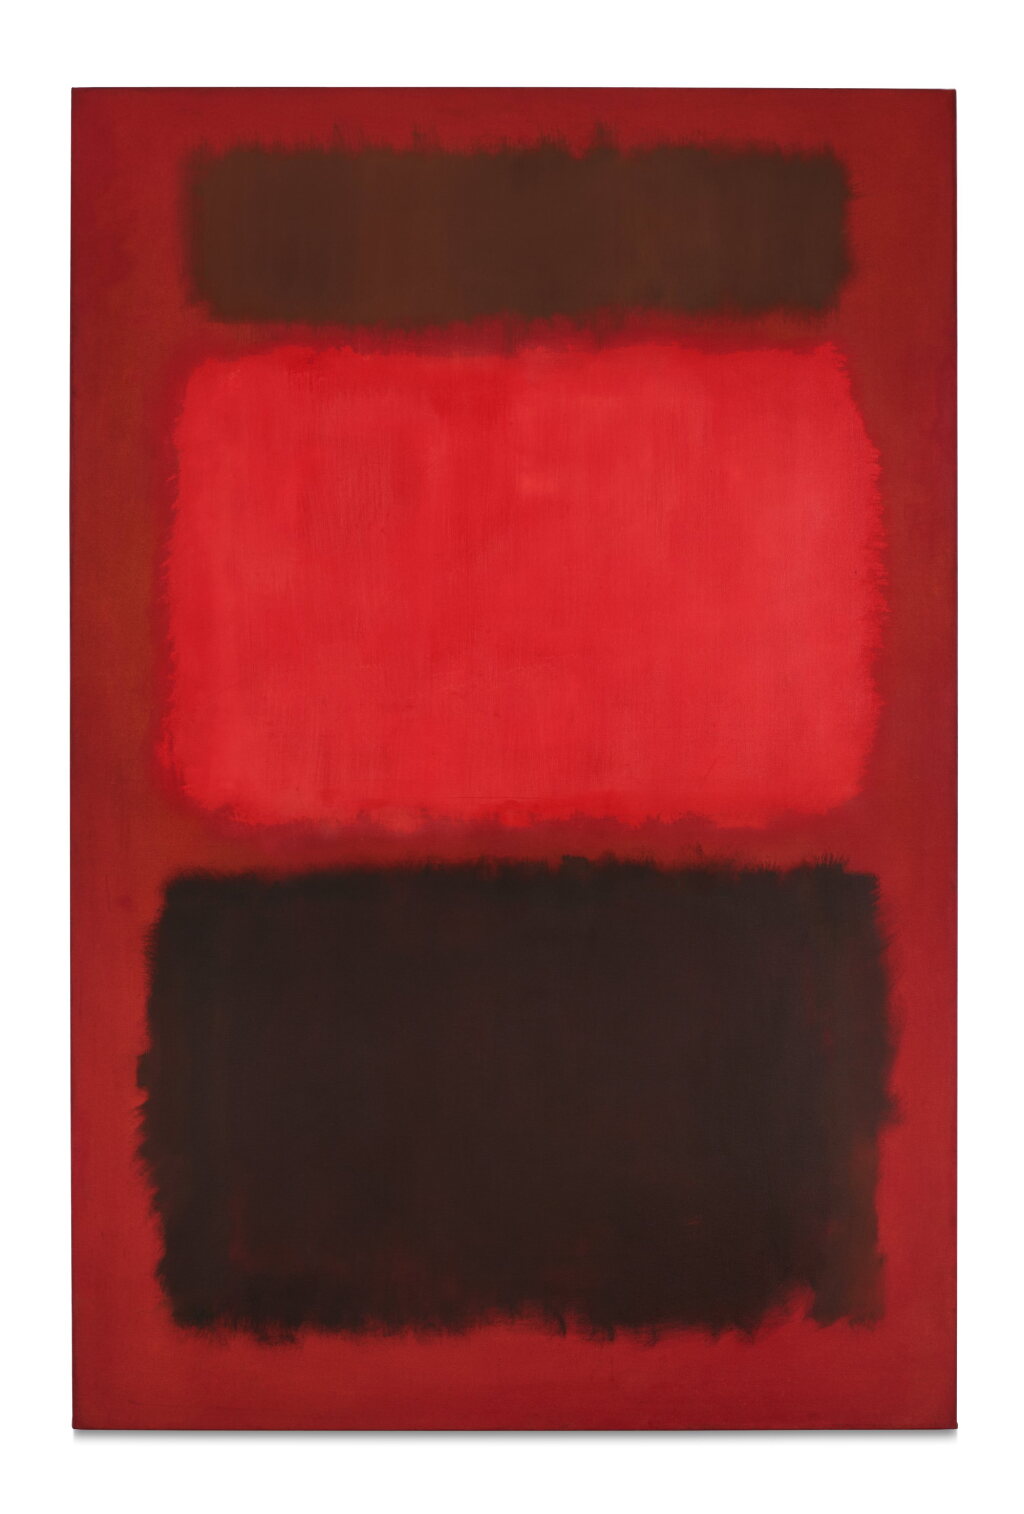


Art market intelligence · from five years of auction results
Know what it's worth
before you buy.
Valuations, artist market dashboards and a Go/No-Go — built from five years of results at Christie’s, Sotheby’s, Phillips and Bonhams.
Rolling 12-month data · refreshed weekly · Christie's, Sotheby's, Phillips, Bonhams
Wherever you buy
The auction record is the evidence.
Use it at auction, at the fair, in the gallery.
Every price a dealer quotes, every estimate in a catalogue, every booth at Frieze or Basel can be checked against what buyers actually paid.

.jpg?width=640)
See Your Market Edge
Fifteen charts per artist. Three of them, drawn from live data, show what a catalogue never tells you — before you buy.
Spot Value in a Noisy Market
Our Market Efficiency scatter plot maps hammer-to-estimate ratios against sale volume, surfacing undervalued artists and overheated segments at a glance.
Diversify by Medium & Price
Visualise an artist's sales distribution by medium and price bracket. Identify the most liquid categories and spot where supply meets demand.
Mediums
Target the Golden Periods
Year-created distribution charts reveal which creative periods the market values most. Time your acquisitions around proven demand patterns.
Stay ahead
Never miss a lot that matters
Nightly matching
Your saved artists are matched every night against 3,000+ upcoming lots at Christie’s, Sotheby’s, Phillips and Bonhams.
Urgency badges
See when a sale is days or hours away — before anyone else bids.
Weekly digest
A personalised auction calendar in your inbox every Monday.
Filter and sort
By house, by soonest, by highest estimate — with lot details expanded.
Auction reports, every week
Read the sale before the next one
Post-sale analysis of major sales at the four houses: what cleared, what didn't, and why. Pro members also get the weekly market brief and audio read-throughs.
How it's built
Every number is computed from auction records. The AI writes the reasoning, never the numbers.
Hammer ratios, sell-through, price bands and comparables come straight from the sale results. The model explains them and says when the evidence is thin. Read the methodology or open a real report.
Built by a Sotheby's Institute alumnus · CanvasArtTech OÜ, Estonia
- 184,000
- auction records, five years
- 4
- houses: Christie’s, Sotheby’s, Phillips, Bonhams
- 35,000+
- artists with a market dashboard
- 0
- numbers written by the AI
Simple, Transparent Pricing
Start free. Upgrade when you're ready.
All plans include access to the platform and dedicated support.
FREE
- Unlimited artist dashboards — full charts & data
- 1 free AI artist analysis
- 3 quick valuations / month
- Published auction reports
- Save up to 3 artists
- Auction alerts (3 artists)
- 1 art event near you / week
Get Started
Free forever — no credit card required
PRO
billed monthly
- AI investment thesis & Go/No-Go signals — every artist
- AI market analysis & lot-level insights
- Full AI artwork valuations
- AI Auction Advisor
- Unlimited saved artists
- Unlimited auction alerts
- Weekly auction alert email digest
- PDF report export
- Premium reports
- Up to 8 art events near you
Start 14-Day Free Trial
Free for 14 days, then $29/mo — cancel anytime
INSTITUTIONAL
billed monthly
- Everything in Pro
- Priority support
- Higher usage ceilings for research-heavy sessions
- Built for advisors, galleries and family offices
Start 7-Day Free Trial
Free for 7 days, then $149/mo — cancel anytime
iOS App
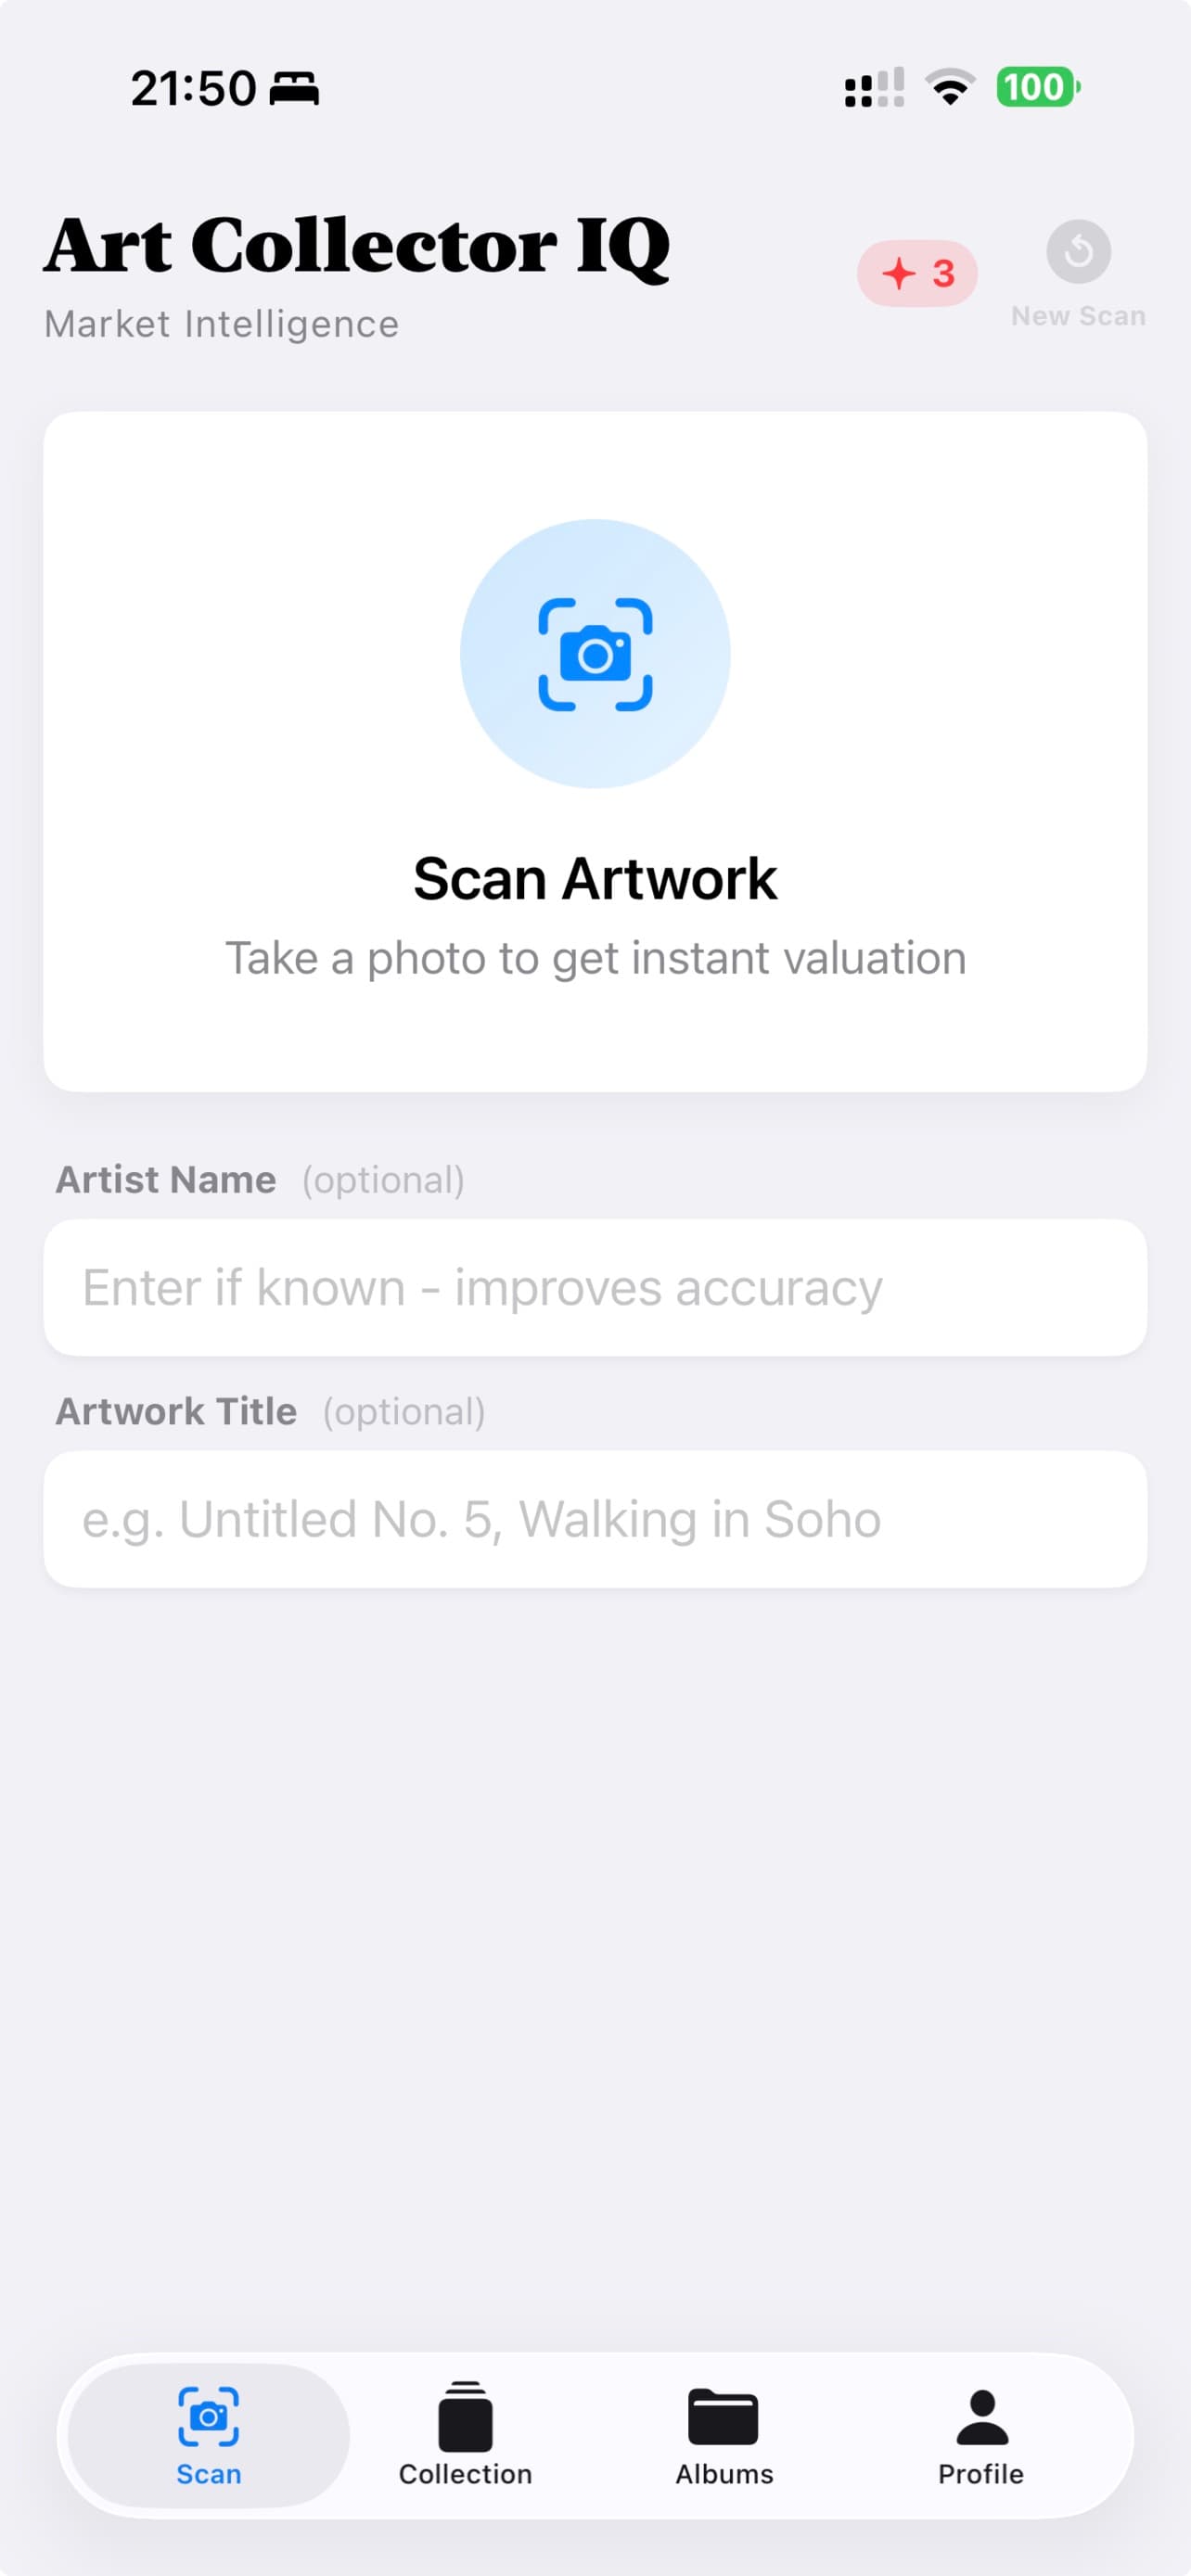
Scan any artwork at the fair. Get an instant valuation.
Free to download · 3 scans included · the same five years of results, in your pocket at the booth

Frequently Asked Questions
Artwork images courtesy of the auction houses' public catalogues · Christie's, Sotheby's, Phillips, Bonhams